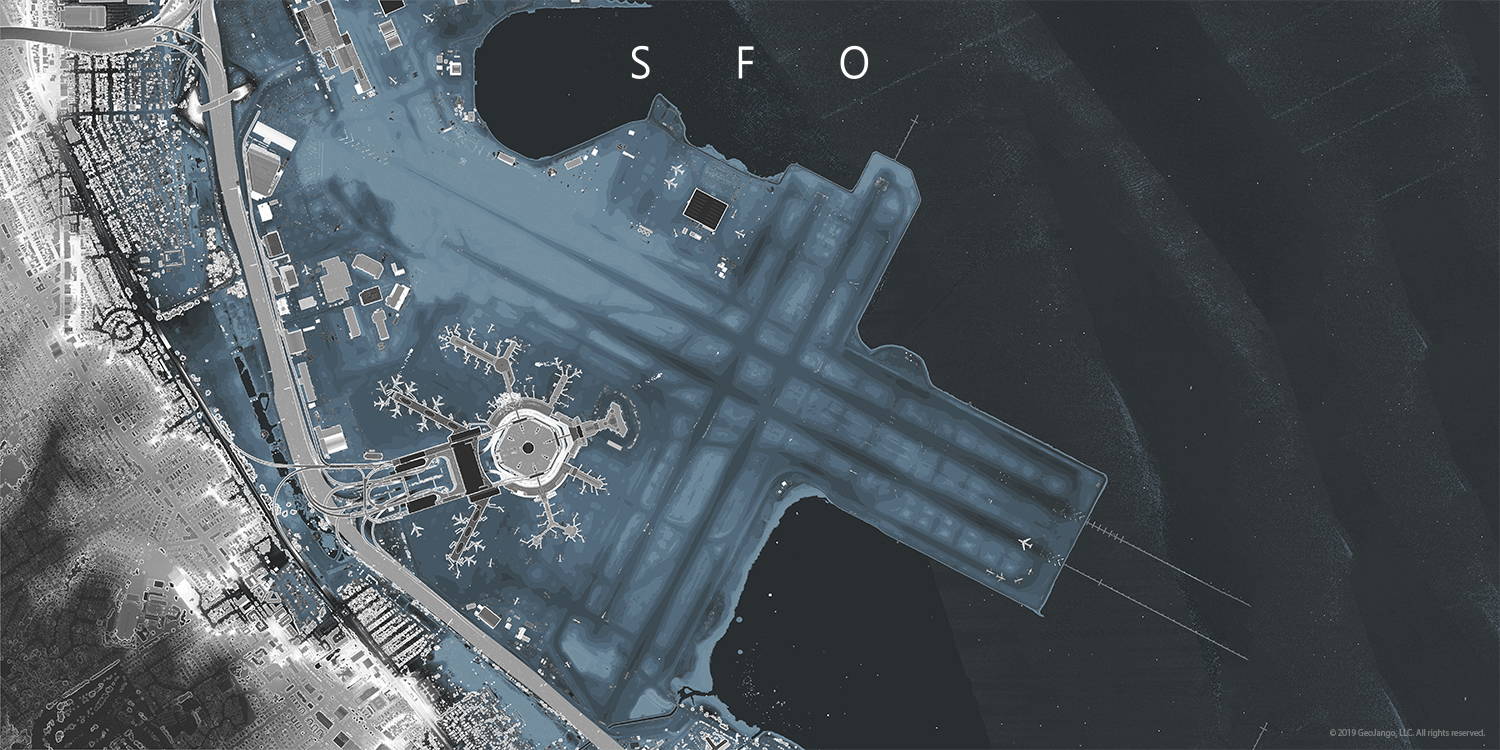
This San Francisco SFO Airport Map - was uniquely created from millions of data points. It can also be called a Measurement Map as the data points are precise measurements. Over 70,000,000 data points were georeferenced with an average spacing of 6 cubic inches (about the size of your hand) to produce the visualization. Yet, it gets better than that: The data can be used to interpolate measurements between postings, for 1-3 inch fine detailed measurements.

In this visualization, you can see things that normally are not discernible, like identifying the location of warn-paths in the runways when the planes touch down for landing.

A flock of birds are also identified on the north side of the main terminal.  

The height of the waves in the San Francisco Bay along with all of the infrastructure (posts, piers, towers) in the Bay can be identified and measured.

About LiDAR:  Light Detection and Ranging (LiDAR) data provides information on the height of objects and pass through certain objects to object subsequent measurement points.

About the creation: GIS software was used to process the volumes of Big Data in a series of conversions, merging, categorizing, smoothing, and symbolizing.  


The Age of BIG DATA Visualization


In this scene, you can see the pathways of the roads along with the over and underpasses. The flyway from 101 to I-380 are easily distinguishable. Other features that can be depicted from the measurements are houses, structures, cars, birds, trees, vegetation, and equipment on structures.  

Detailed view near SFO at the interchange of I-380 and US101.

About our unique LiDAR data into art process:

The creation on the LiDAR map was made using GIS software processing public domain LiDAR data. The LiDAR data was classified into specific classes to define the elevation as well as objects on the surface such as trees, bushes, high wires, monorails, and structures. The data was then transposed into raster and contours to highlight these features. A shaded relief was created to depict the altitude of the sun and shadowing effects in the scene. The data layers were then merged and symbolized to produce the final product.


LiDAR Data Collection

LiDAR Collection
LiDAR data

Cross section of the LiDAR collection showing the ground level data and details of the vegetation.

A side view of LiDAR Data: Because of its high sampling rate, LiDAR data can be used to estimate the height of vegetation and objects. If vegetation gets to a dangerous height, the data can identify the precise location for trimming.


Modern Decor Airport Map


The SFO Visualization Map is available for purchase here.

Print Sizes: 24 (w) x 12 (h) inches to 48 (w) x 24 (h) inches.

Material:  The prints are unframed and are printed on Fine Art Photo Satin Paper.

Larger sizes are also available (up to 10 feet wide). The map can be printed as Removable Wall Sticker. Please send a request (contact us) and include the measure of the width that you would like. We will calculate the ratio of the height so the map is not distorted.

Deborah Dennison, MGIS, GISP