Visualizing the Power of the Nation: How GIS Brought the U.S. Electric Grid to Life

The U.S. electric grid is one of the most complex and expansive infrastructures in the world. With thousands of miles of transmission lines, a vast network of power plants, and an intricate web of administrative service areas, the grid powers our homes, businesses, and increasingly, the technologies of the future. Yet, understanding how this vital system works and where its components lie has remained inaccessible to most—until now.

At GeoJango Maps, we set out to change that.

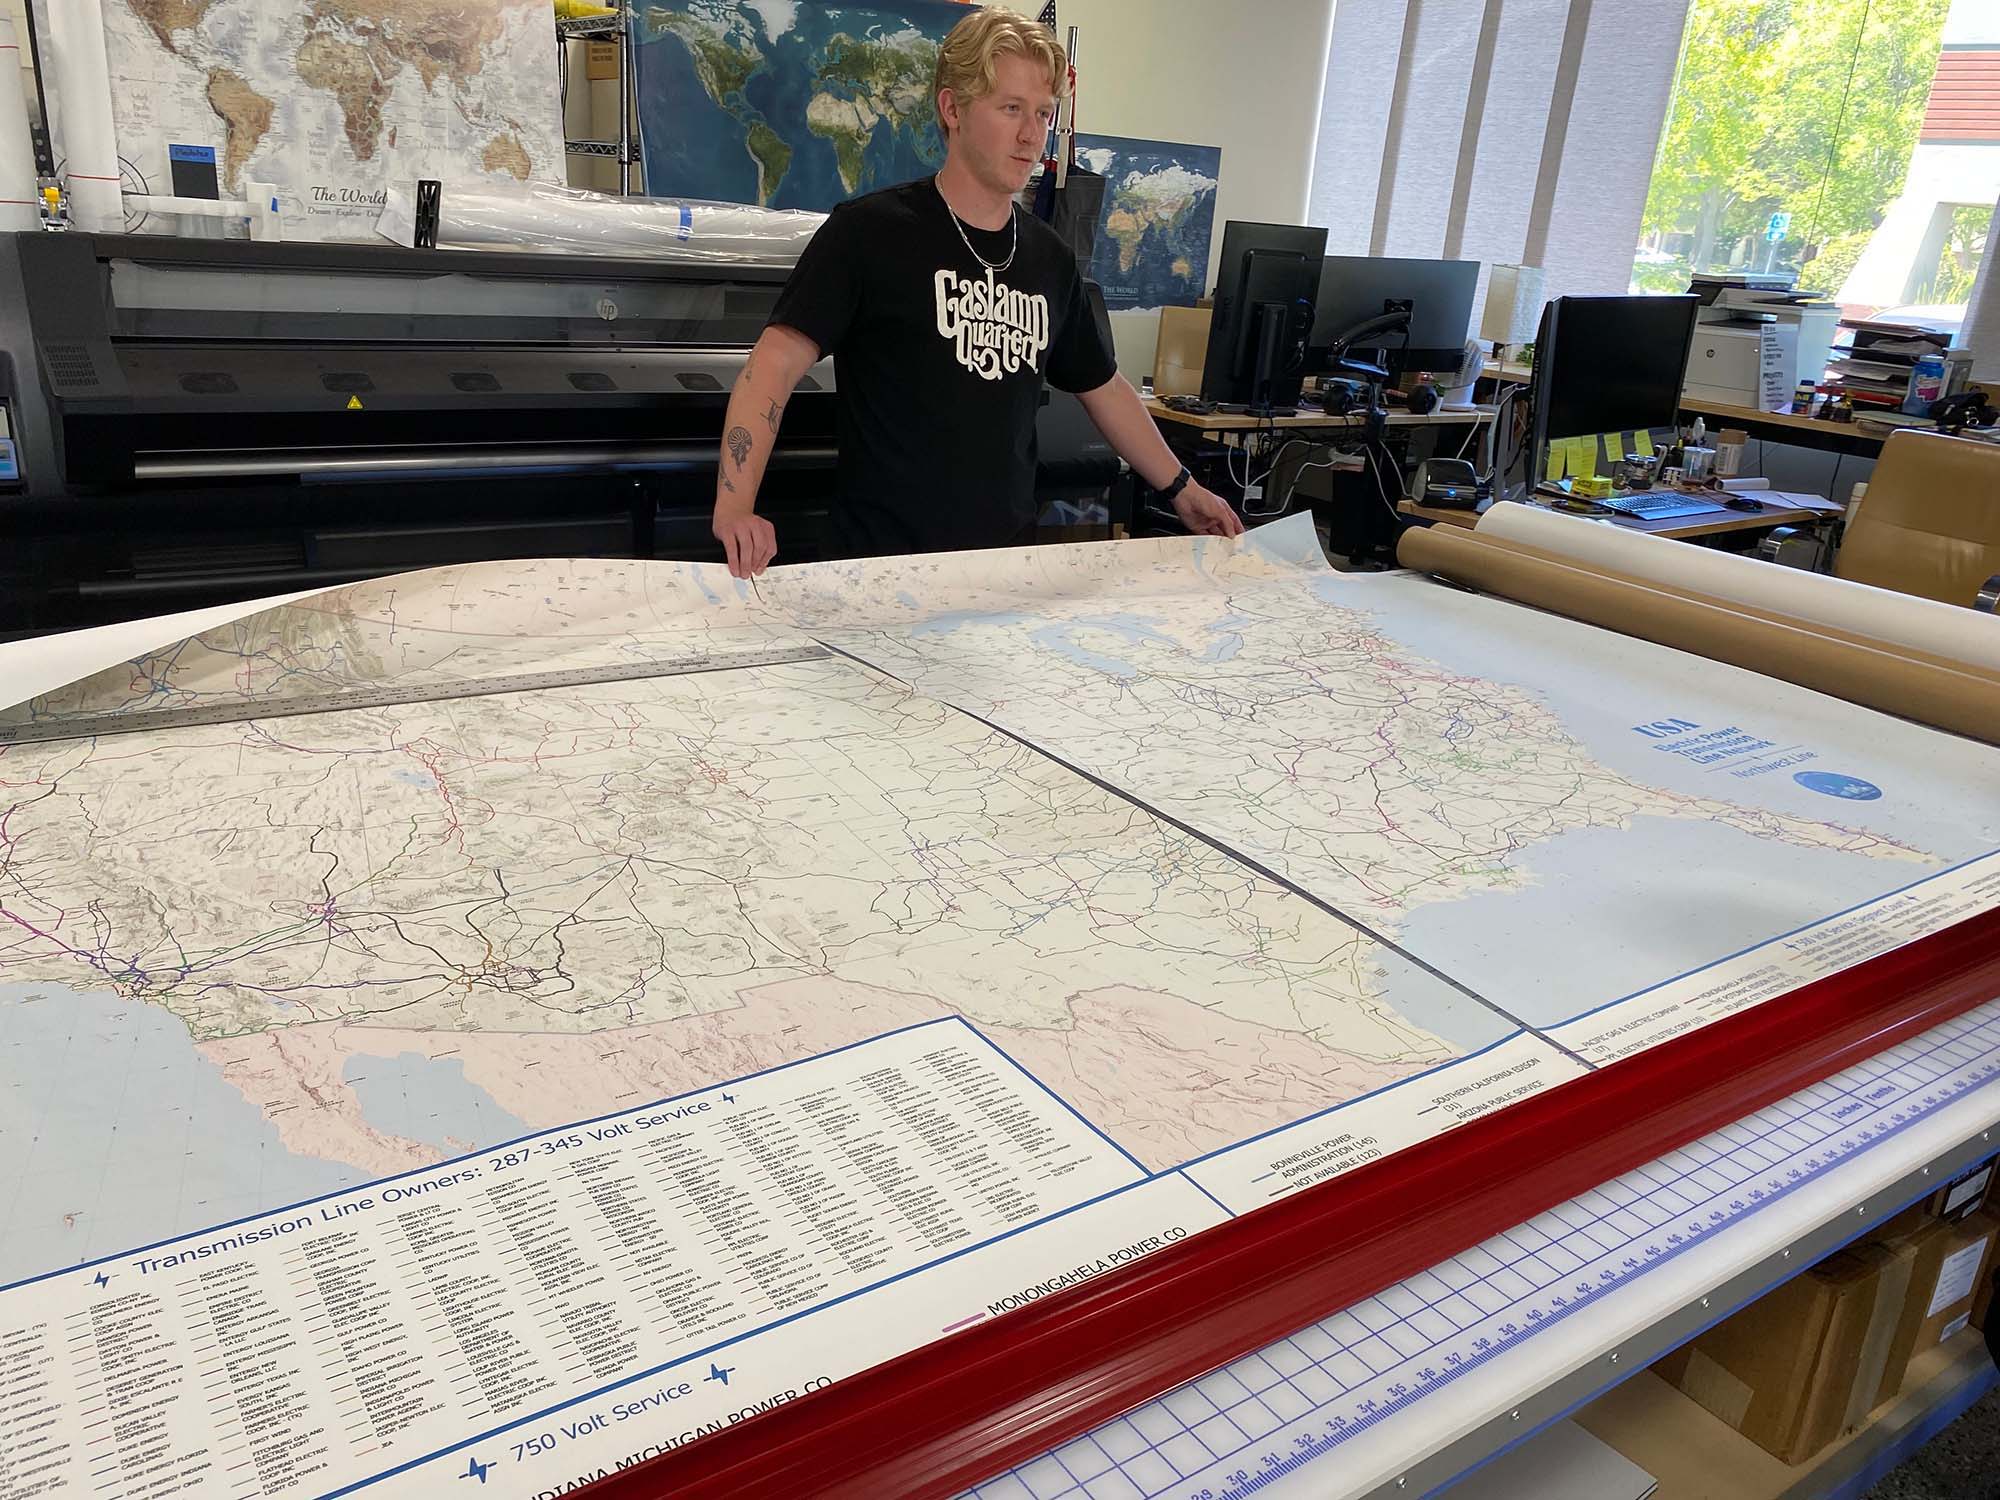
Our USA Electric Transmission Grid Map is a large-format, GIS-based visualization that reveals the entire electric grid system in extraordinary detail. Unlike basic schematics or abstract diagrams, our map is data-driven, beautiful, and informative—designed for real-world application across the energy industry.

From Data to Design: How We Built the Grid Map

Using advanced Esri GIS software, we collected and processed publicly available geospatial data to map:

  • Power Plants across the United States, including icons representing the type of power generation (nuclear, solar, wind, hydro, coal, natural gas, and more).

  • Transmission Lines with voltage indicators, allowing viewers to trace the high-voltage backbone of the nation's electric infrastructure.

  • The interconnected ridge system, illustrating how energy flows between states and across regions.

  • Administrative Service Areas, identifying the utilities and cooperatives that manage energy delivery.

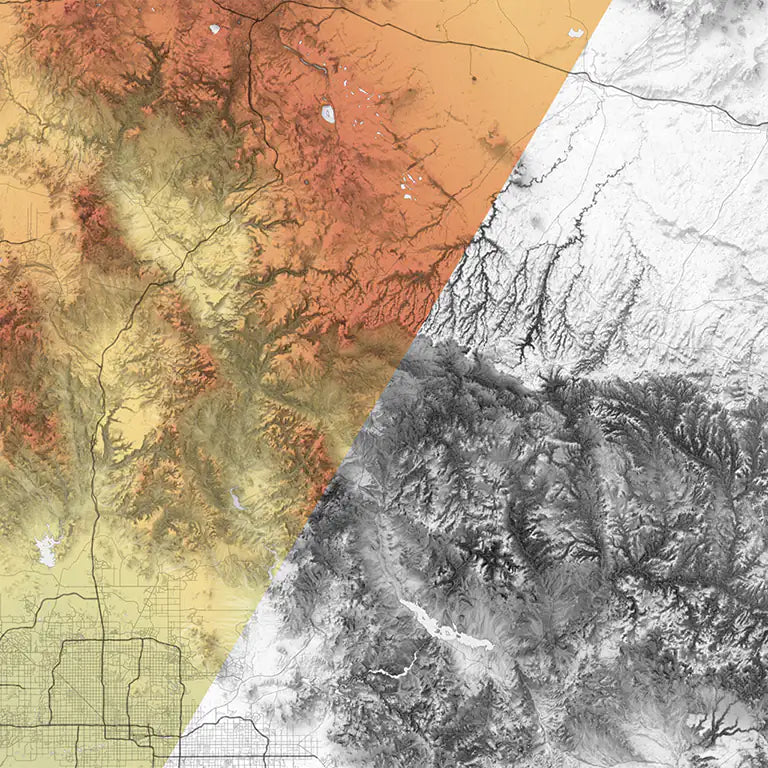
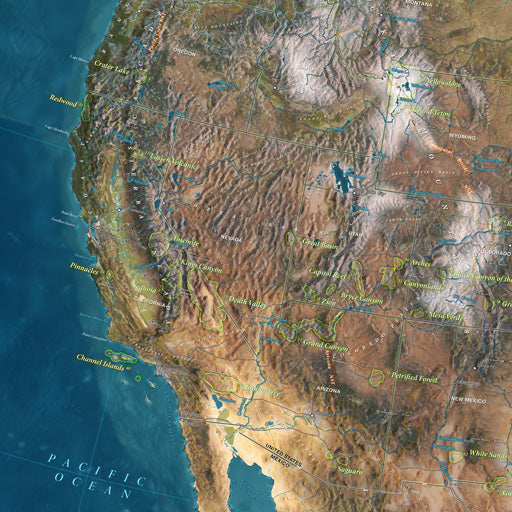
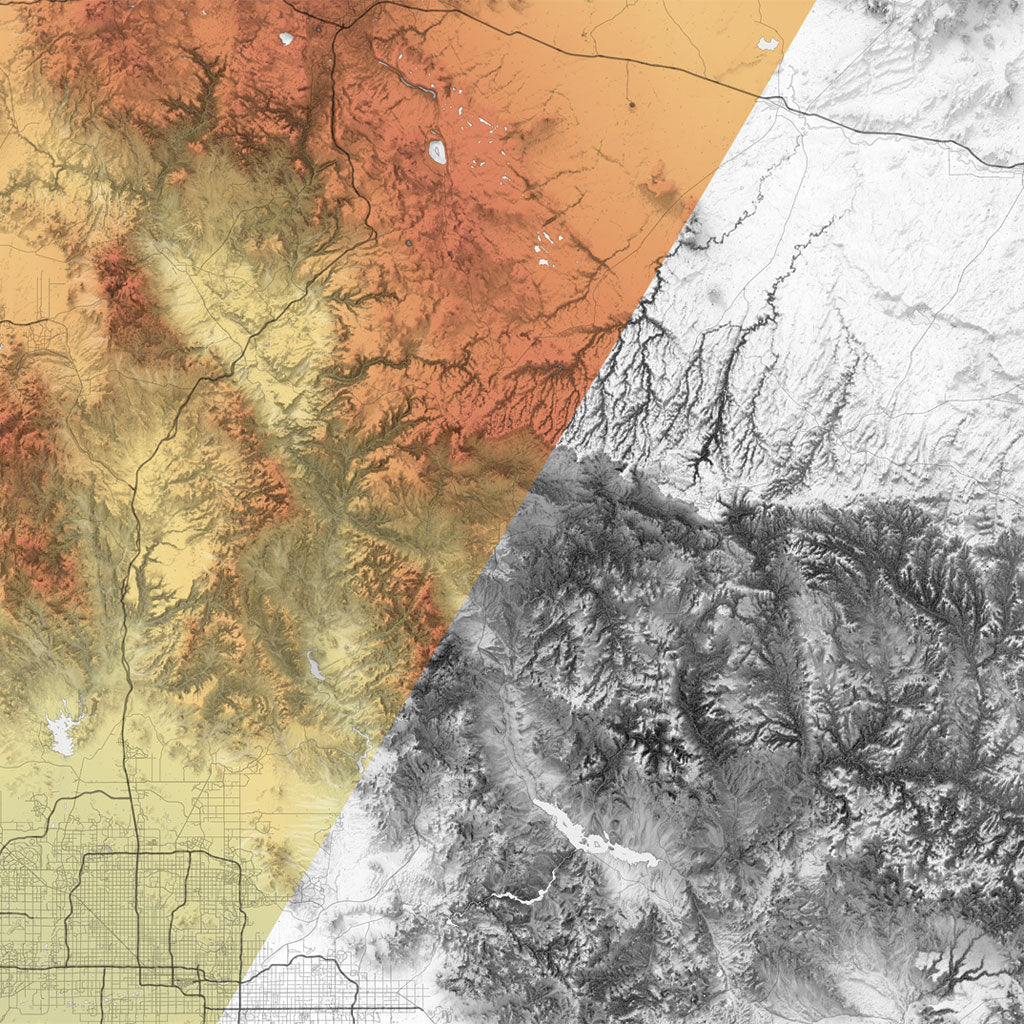
  • State Geography and topographic features that influence infrastructure placement, transmission efficiency, and environmental impact.

Why It Matters: Practical Use Across Industries

This map is more than a work of art—it is a strategic asset for a wide range of professionals:

  • Transmission Line Vocational Schools & Training Centers use the map as a teaching aid to visualize real-world systems.

  • Transmission Line Equipment Suppliers and Manufacturers rely on the map to understand infrastructure locations and plan logistics.

  • Survey and Environmental Firms incorporate it into land assessments and impact studies.

  • Emergency Management Teams use it to identify key grid vulnerabilities and plan for disaster response.

  • Local Governments integrate the map into planning and zoning efforts.

  • EV and Battery Manufacturers use it to evaluate transmission access and grid readiness.

  • Renewable Energy Companies assess regional grid capacity and plan new installations.

A Superior Solution for Energy Professionals

Our map will impress your customers, visitors, and staff! The map provides:

  • Greater Visual Clarity on transmission line hierarchy and voltage.

  • High-Resolution Print Quality for use in command centers, classrooms, and boardrooms.

  • Extensive Labeling of cities, states, plant types, and geographic features.

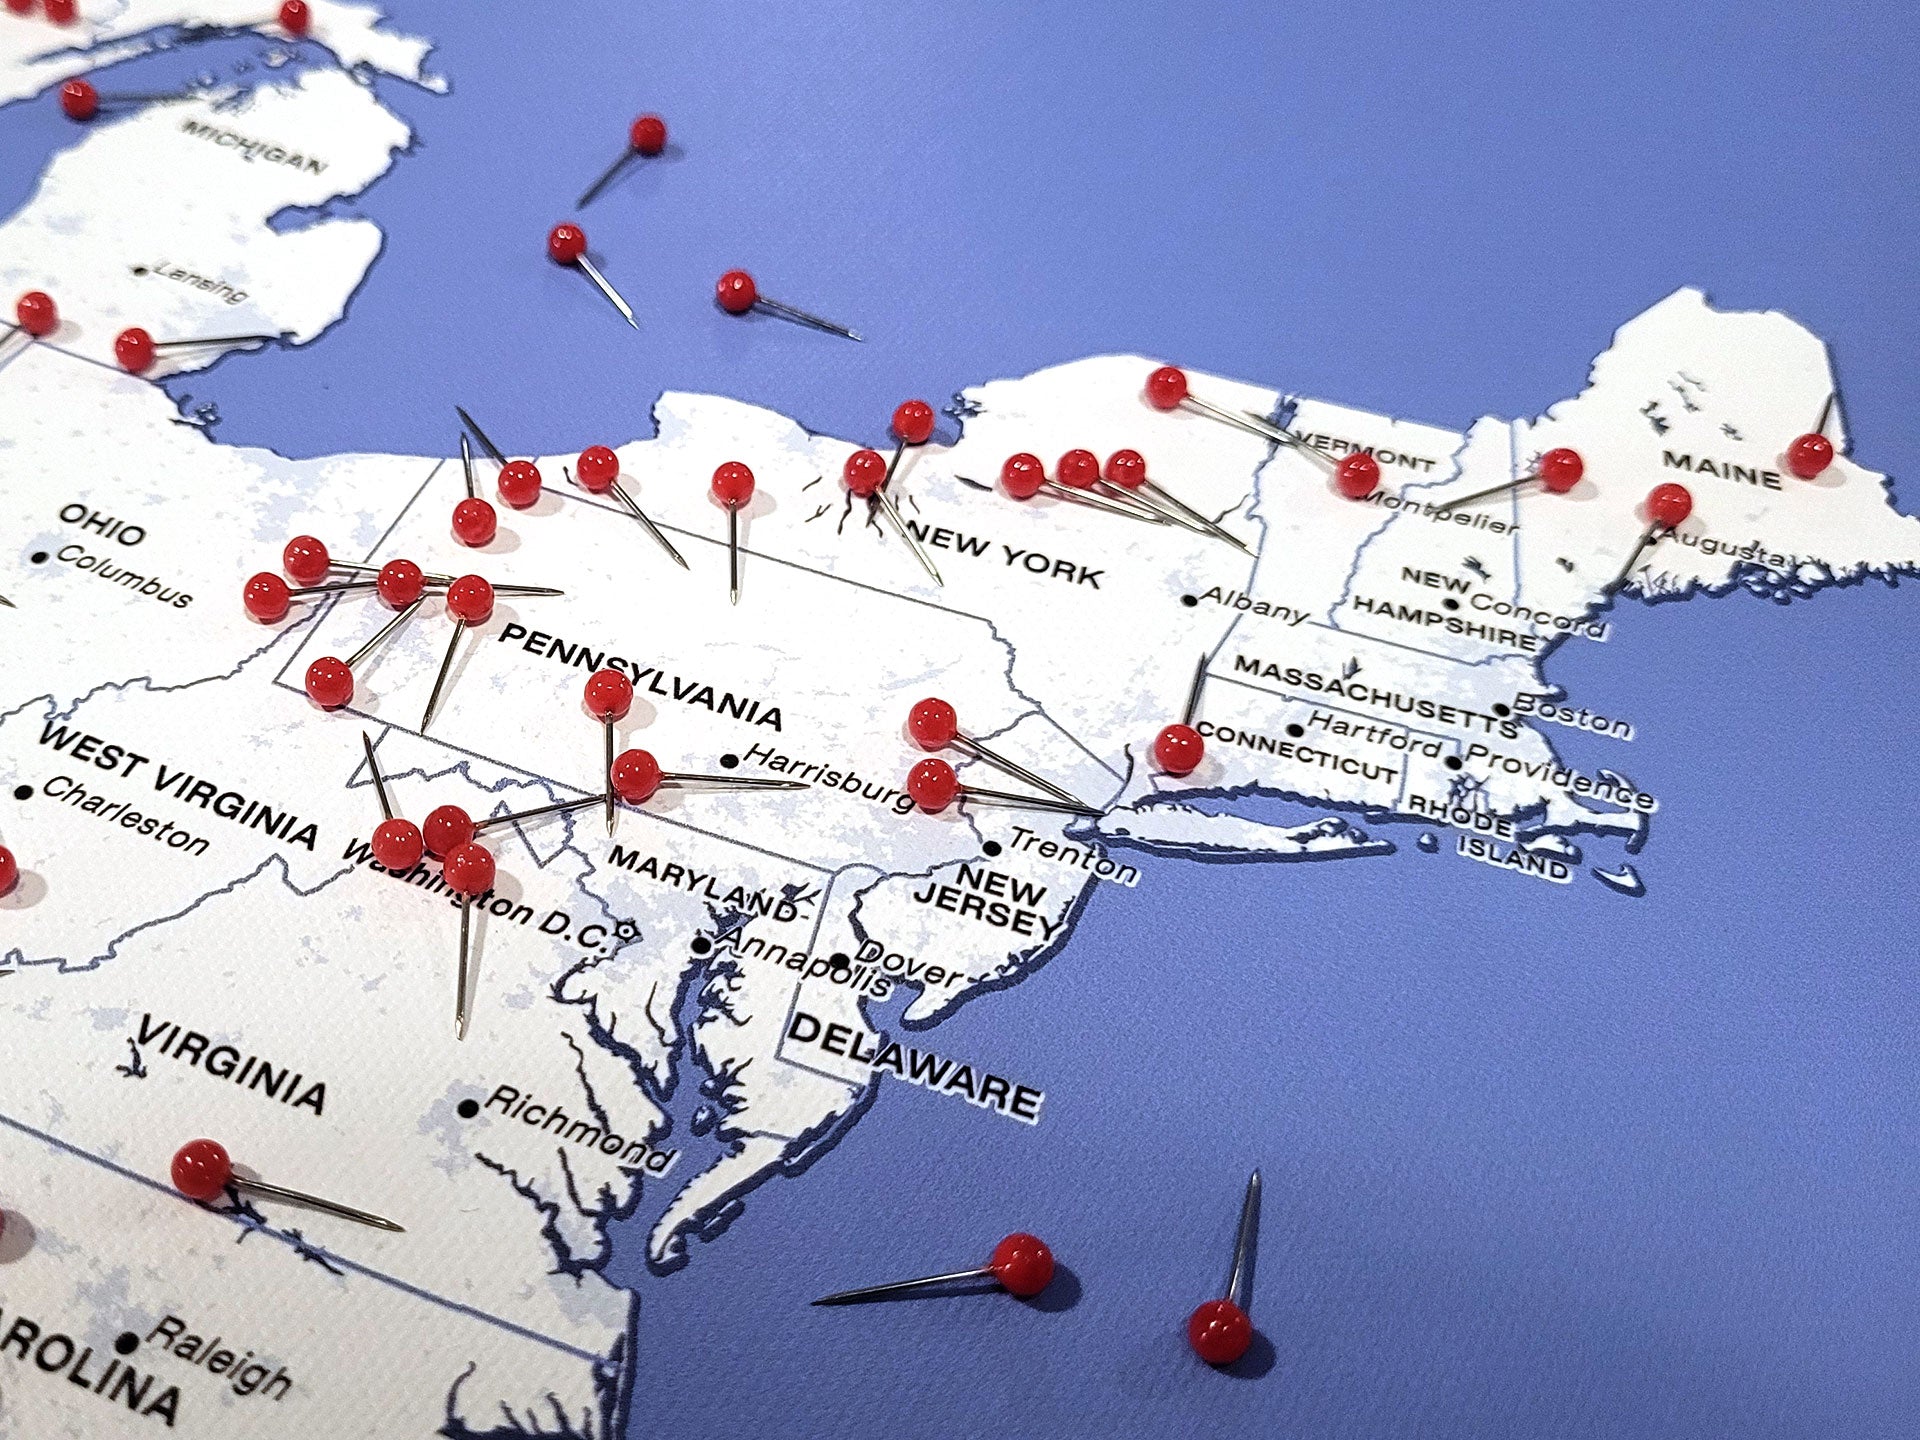
  • Physical Permanence with options for framing, foam backing, or push-pin customization.

Each map is made to order in our advanced production facility, right here in Pleasanton, California, using high-end cartographic techniques and professional printing facility.

D. Dennison, MGIS, GISP