


Visualizing Terrain
What Is Shaded Relief?
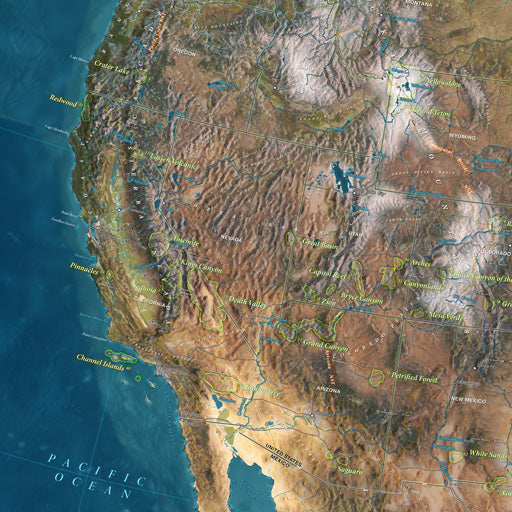
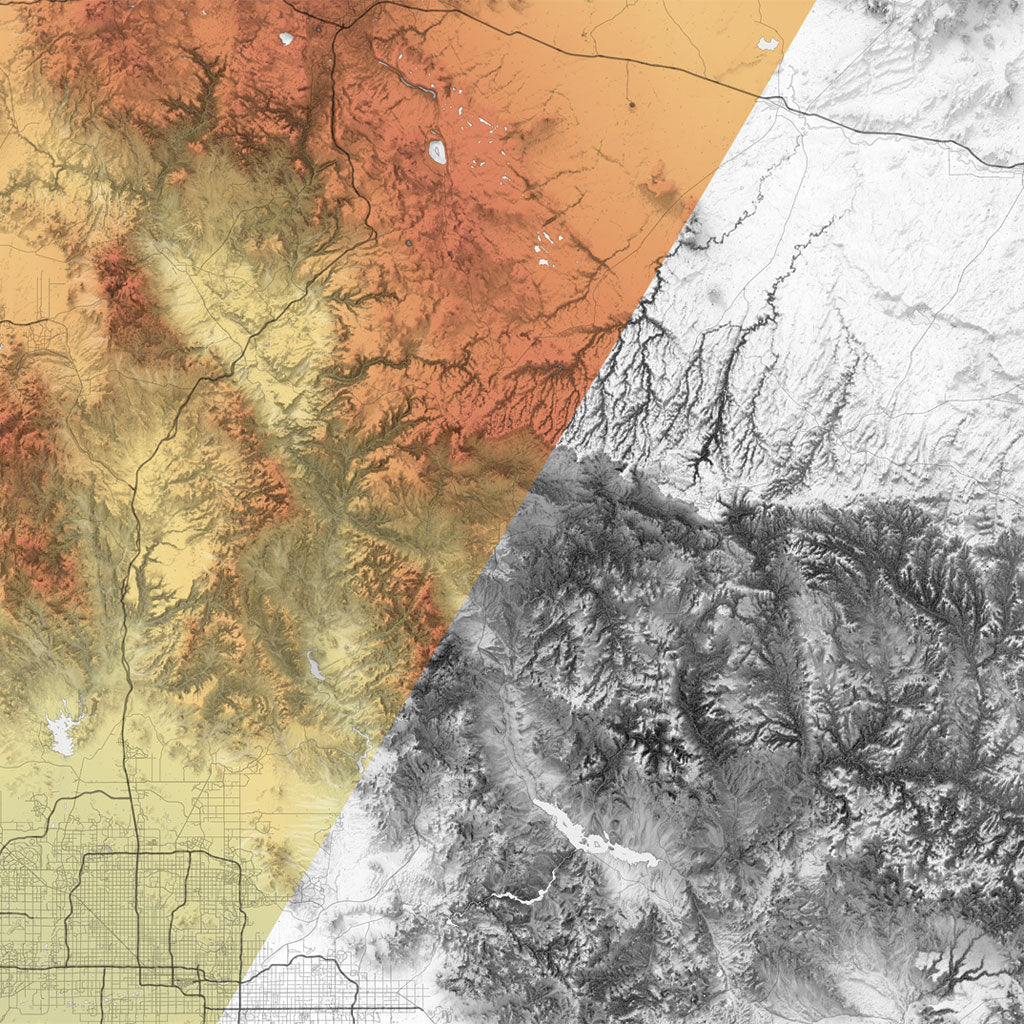
Shaded relief maps are a fascinating and useful tool for understanding the geography and topography of an area. They provide a three-dimensional representation of a terrain, allowing viewers to visualize the height and depth of landforms such as mountains, valleys, and canyons.
California State Shaded Relief Map
How To Read Contour Lines
Aspects of Topographical Maps
Contour lines are the most important feature of a topography map. They connect points of equal elevation and provide a three-dimensional view of the terrain. The closer together the contour lines are, the steeper the terrain. Conversely, the farther apart they are, the flatter the terrain.
Topograhpic Map:
Contour maps, also known as topographic maps, are two-dimensional representations of a three-dimensional terrain or surface, showing the height or elevation of different points on the surface through contour lines. Each contour line represents a specific elevation, with the interval between the lines indicating the difference in height between adjacent lines.
Elevation Map:
Unlike contour maps, which represent elevation through contour lines, elevation maps use color shading or gradient patterns to represent differences in elevation across the terrain. Typically, darker colors or patterns represent lower elevations, while lighter colors or patterns represent higher elevations.
Elevation maps can be created using a variety of methods, including satellite imagery, aerial photography, and ground-based surveys. The accuracy and level of detail of an elevation map depend on the resolution of the data used to create it.
The Great Salt Lake, Utah Elevation Map
Shaded Relief Map:
On the other hand, a shaded relief map uses color and shading to represent the elevation of a terrain. In a shaded relief map, light is simulated as if it were shining on the terrain from a specific direction, typically from the northwest. The areas that face the light source appear bright, while the areas that are in shadow appear dark. The shading creates an illusion of depth, making it easier to visualize the three-dimensional terrain.
Denver, Colorado Shaded Relief Map
GeoJango's Shaded Relief Map Collection
The Science Involved GeoJango's Shaded Relief Maps
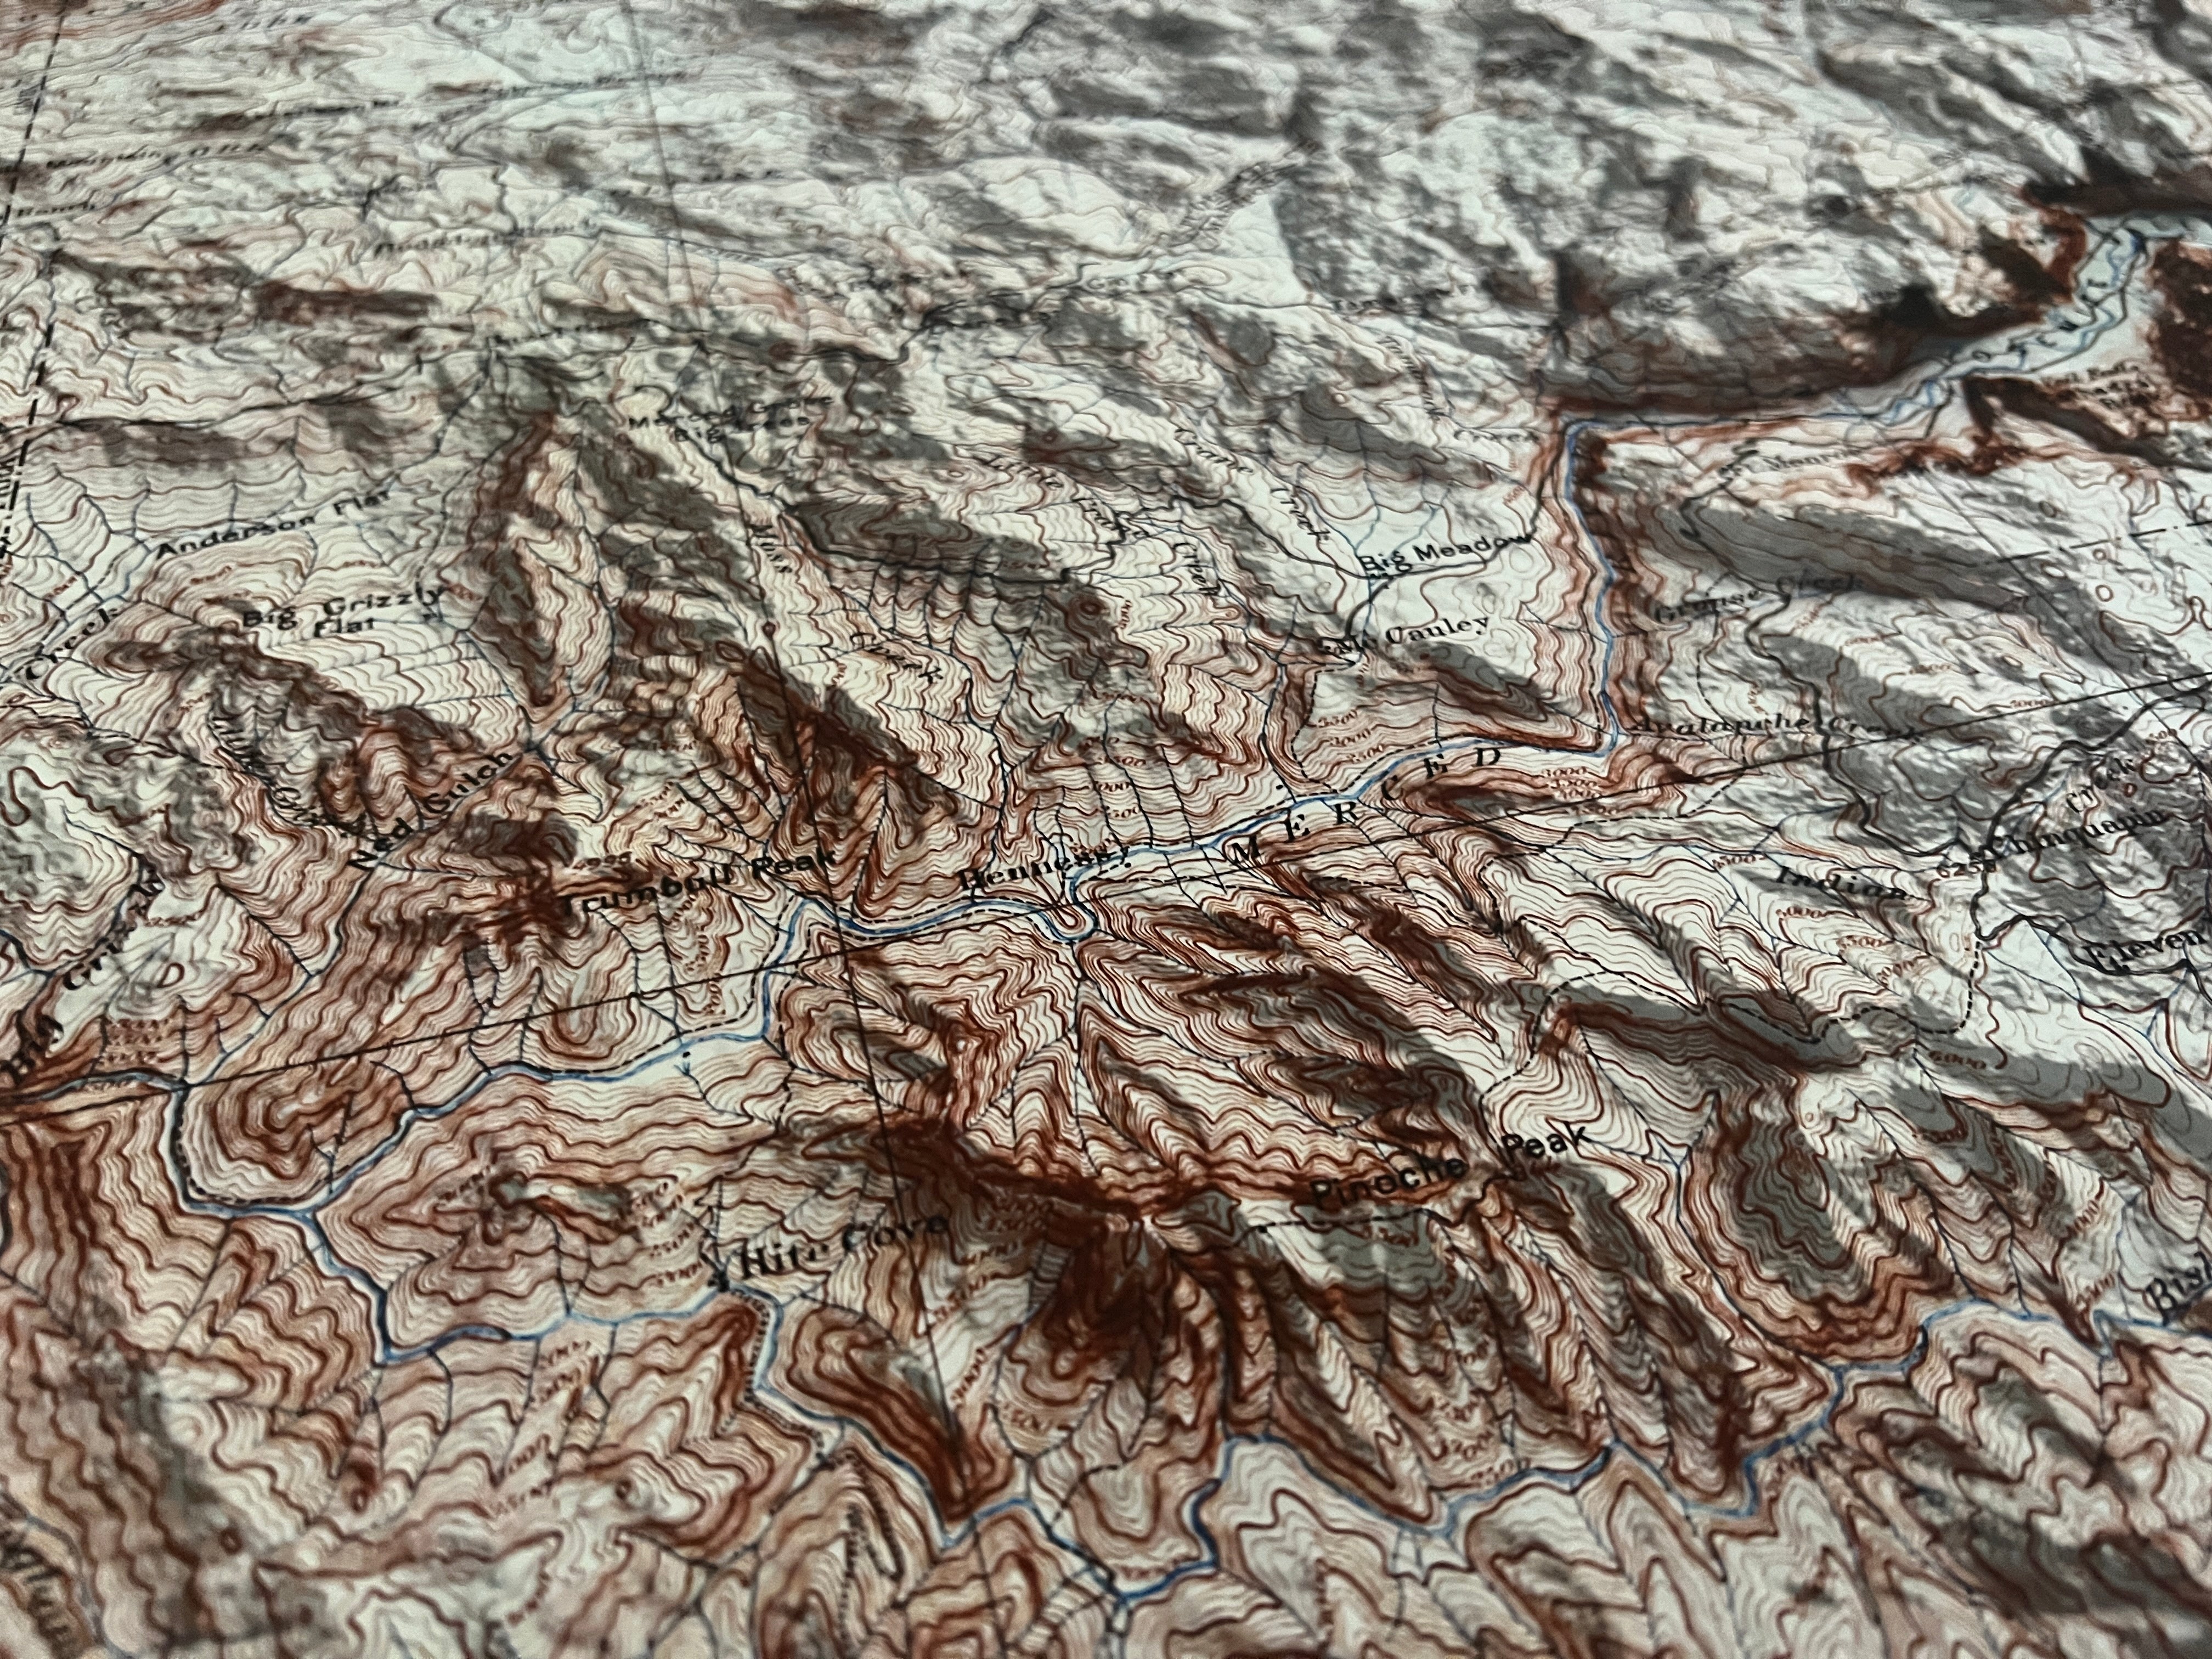
Here at GeoJango we create stunning shaded relief maps using hillshade to create an illusion of depth and texture, while contour lines are used to represent elevation. In this type of map, the contour lines are superimposed over the relief map, so that the viewer can see both the elevation and the texture of the terrain.
Applying Hillshade
We use different times during spring and summer to capture different angles of the sun which is called an azimuth. Hillshade reveals the characteristics is what brings out the natural shape of the terrain.
"Hillshade reveals the complexity and beautiful design in nature."
- Debbie Dennison
Professional Geographer
Detail view of The Great Salt Lake, Utah Elevation Map
"Hill Shade reveals the mystery of nature's complexity"
- Debbie Dennison
Professional Cartographer
ASTER Satellite Data
ASTER (Advanced Spaceborne Thermal Emission and Reflection Radiometer) is a satellite sensor system operated by NASA. To create an elevation map, ASTER uses a technique called stereoscopy. The system collects data from two slightly offset angles, which allows it to create a 3D model of the Earth's surface. By analyzing the reflectance and temperature of different surface features, ASTER can produce highly detailed maps of the Earth's topography.
Grand Canyon Shaded Relief Map
Interior Design Ideas for Environmental Wall Art
Group your favorite states together to create a beautiful display in your lobby, office, or home.